VIATECH
Safety and sustainability.
+47 32 73 66 32
ViaTech is a Norwegian corporation with a wide range of high-tech products aimed at road, rail and airport authorities worldwide. The headquarters are located in Kongsberg city.
Take a look at ourproducts and services
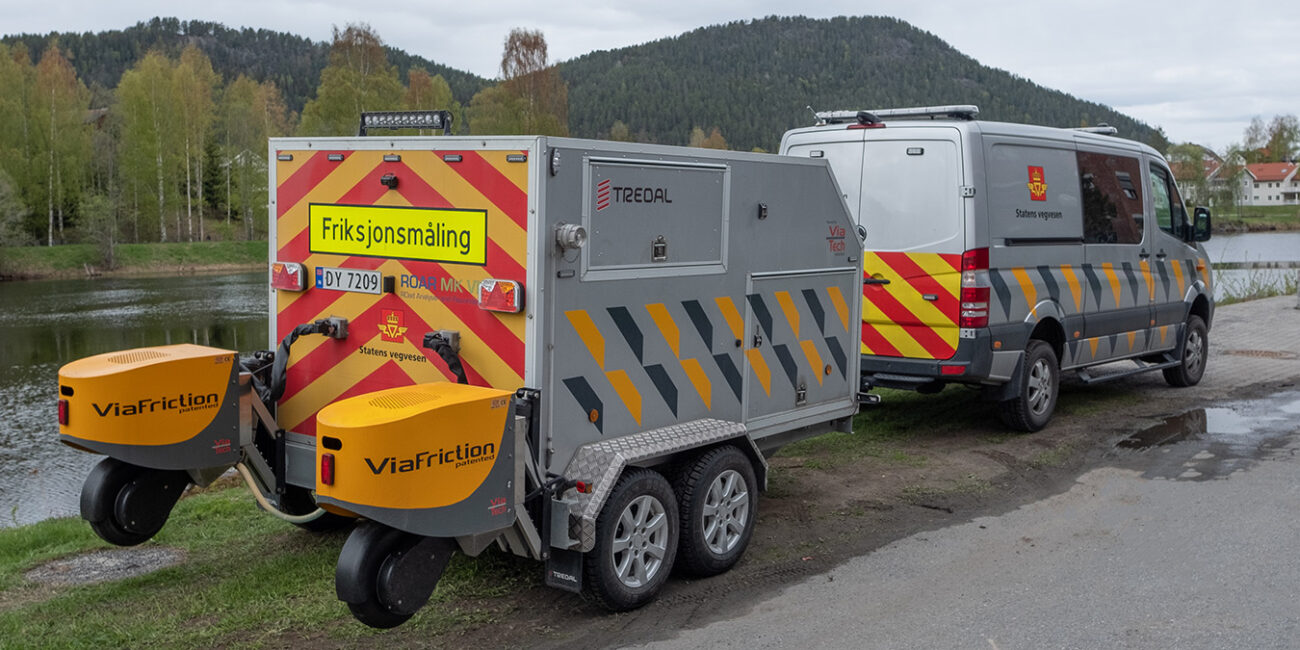
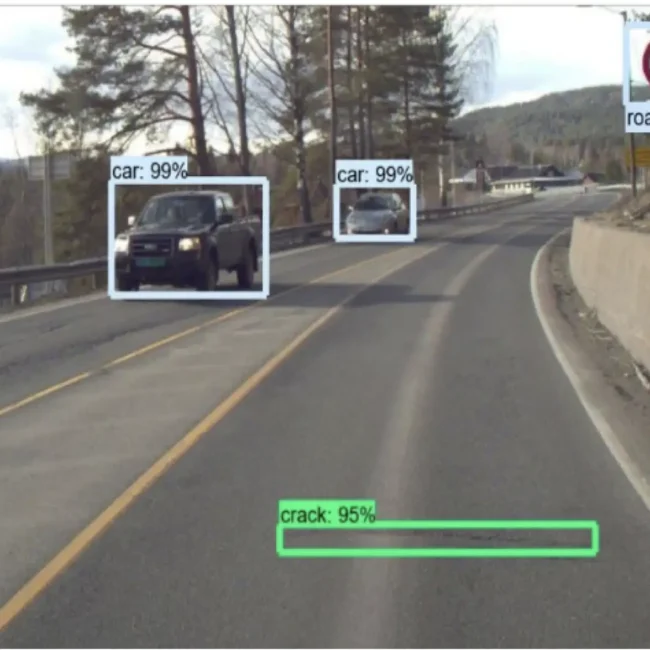
Friction Measurement
The highway to advanced solutions
Visit our product page for detailed information about what we can do to help you monitor the condition of roads and airfields. We offer a wide range of products.
As a leader in the industry, we offer a wide range of products so you can gain the most accurate understanding of your pavement condition.Our state-of-the-art solutions ensures that you get reliable data.
We offer services in friction, scanning and photo for your organization. We strive to keep your products running efficiently at all times. – The quality of service must match the integrity of the products.
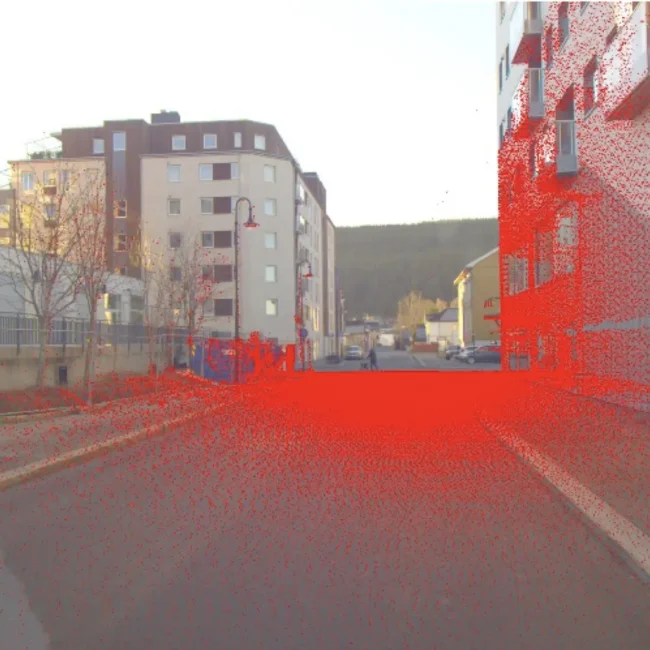
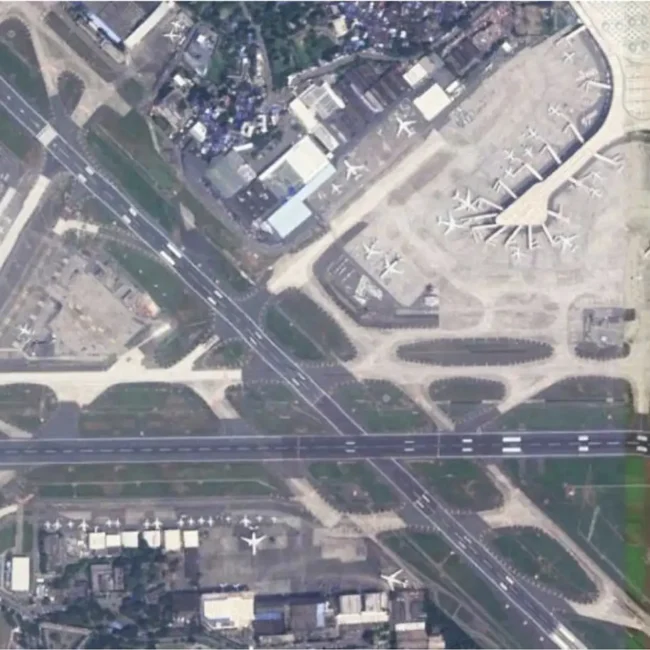
The Norwegian Public Road Administration has worked closely with ViaTech since 2002. We are currently running 7 ViaPPS vehicles from ViaTech in order to monitor the condition of the road network in Norway. In addition, the vehicles check newly laid asphalt surfaces. Each ViaPPS vehicle is equipped with a 360 LIDAR, cameras, and an accurate positioning system. The images from the cameras can be viewed on the website Vegbilder. The road condition measured by ViaPPS is used for maintenance planning, enabling an optimal use of the available maintenance resources.
The Norwegian Public Road Administration also has approximately 35 friction systems, ViaFriction Winter and Roar. Friction measurements is used for road quality assessment. This is an important tool to evaluate if measures have the expected effect, and that the road standards are met even in winter conditions. Friction is also used for checking both new and old road surfaces during summer.
Bård Nonstad – Statens vegvesen Drift og vedlikehold
★★★★★5/5
“After more than ten years of working with Halvard Haugland at Viatech, I can confidently say that he knows what he’s doing. He is easily accessible, and not least very skilled.”
We have had a good customer relationship and collaboration with Viatech for many years, and we use both software and measurement systems for road analysis from Viatech in our daily work!
Ingrid Johnsbråten Börjars,Field Group, Production Manager MMS
Get in touch
We will answer in a short amount of time.
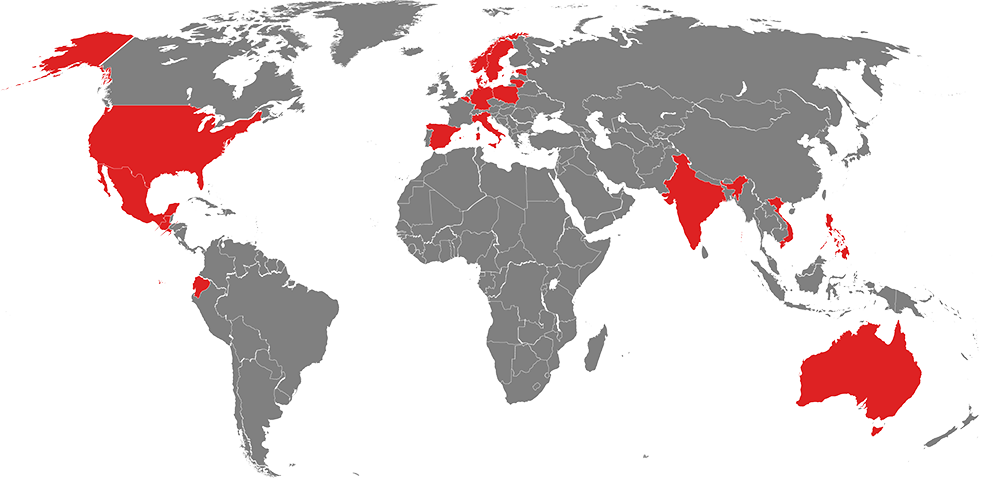
Some of ourpartners
We are proud to work with some of the best companys in the business and in the entire world. Thanks to good partnership agreements, both our customer base and theirs are increasing.